Devil Watchdog
One control room for every site, server and cron job — and a Telegram message when something breaks
Overview
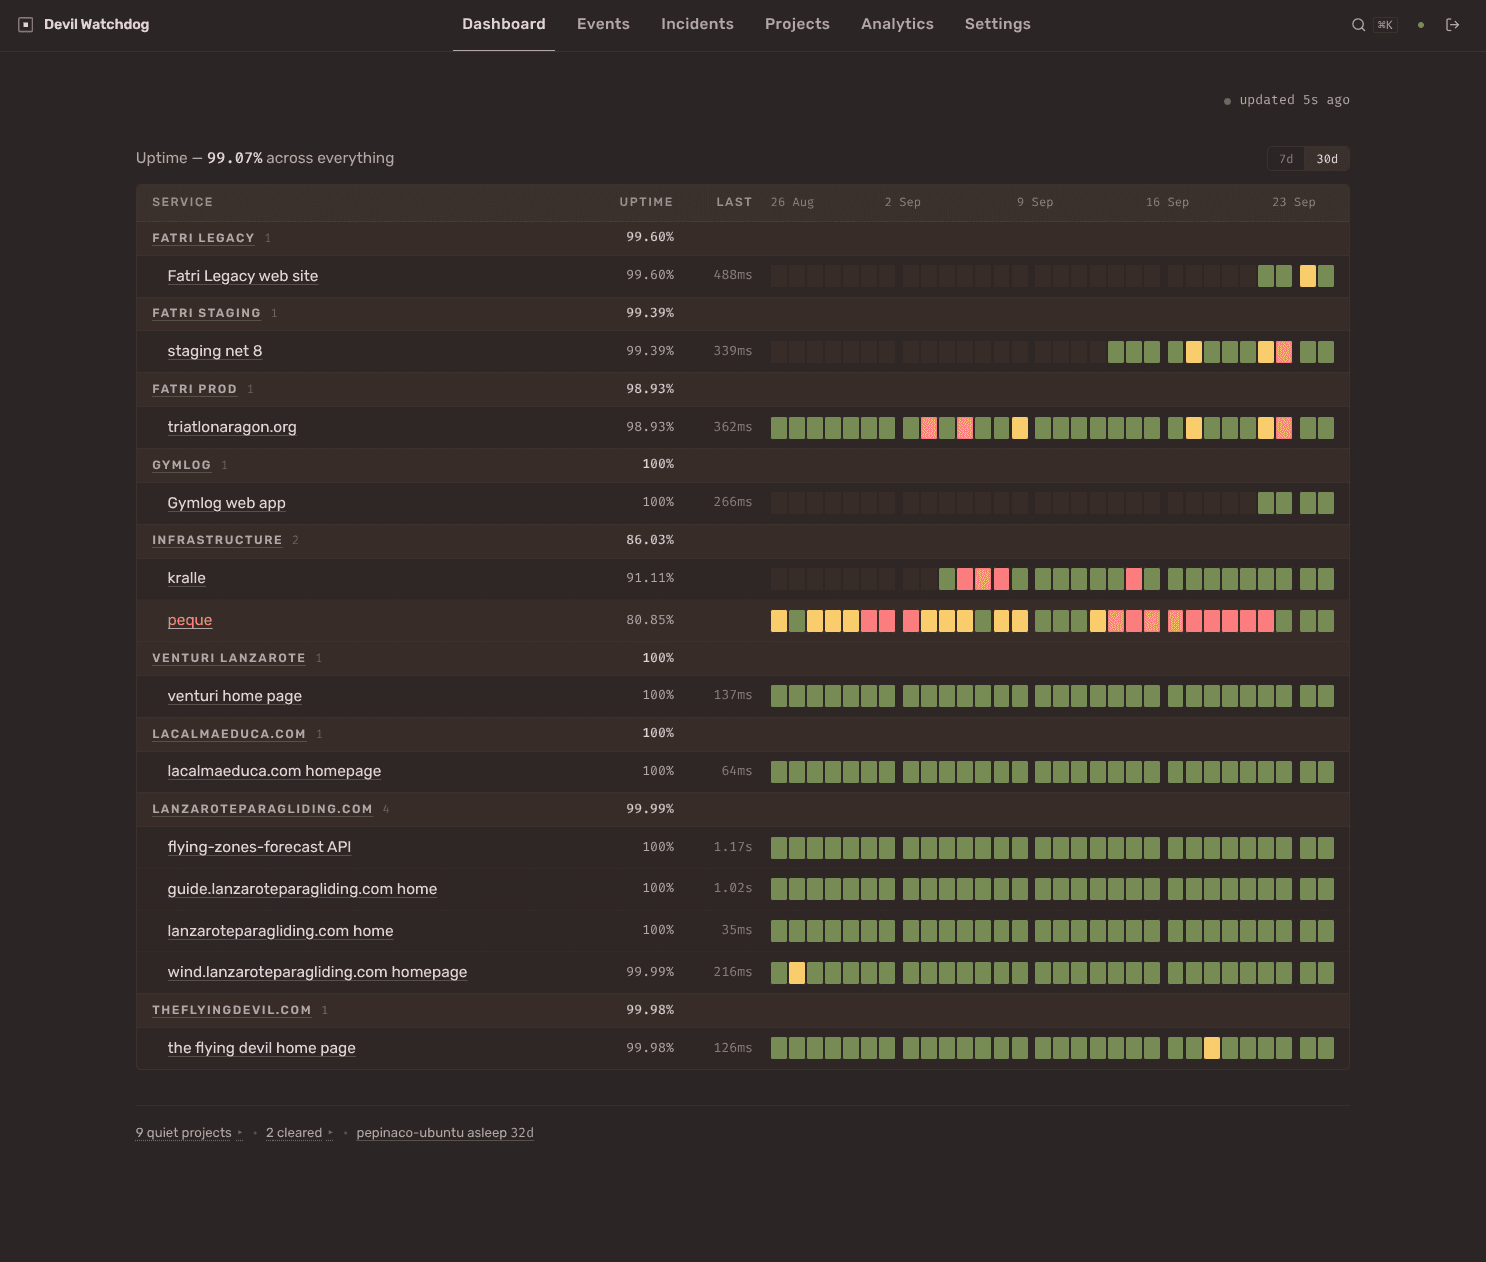
A centralized event monitoring hub for websites, apps, servers and cron jobs. Applications push structured events to it, it polls endpoints for uptime, servers report their own health, and cron jobs check in when they finish. When something goes wrong it says so on Telegram. When everything is fine the dashboard reads grey on purpose — the only colour on screen is a problem.
Monitoring tends to arrive as a dozen half-solutions: uptime from one service, server metrics from another, cron failures from nowhere at all, and logs scattered across machines. The failure that actually hurts is the silent one — the backup that stopped running three weeks ago, the nightly job that quietly never fired. Nothing alerts on an event that never happened.
One hub with four ways in. Events are pushed by any app or script to a single API endpoint, authenticated per project. Monitors actively poll endpoints and validate the response body, catching the 200-with-an-error-page case. Heartbeats are dead-man switches: a cron job curls a secret ping URL when it finishes, and silence becomes a critical alert. Watch rules do the same for events — if backup.completed has not arrived in 24 hours, that absence is the alert. A zero-dependency bash agent reports disk, memory, CPU, load and systemd state every five minutes.
The dashboard answers one question in its headline — does anything need me — then lists every problem once above a per-project board. Analytics looks backwards instead of counting events: uptime ranked worst first over 90 days, incidents with median recovery and repeat offenders, alerts that fired for something that healed itself. Notification rules carry cooldowns and thresholds so a noisy source cannot flood the chat, and every dispatch decision is logged and inspectable.